One source of truth
Every channel, sale, and lead in one place, modeled consistently so the numbers match across teams.

Data & Analytics
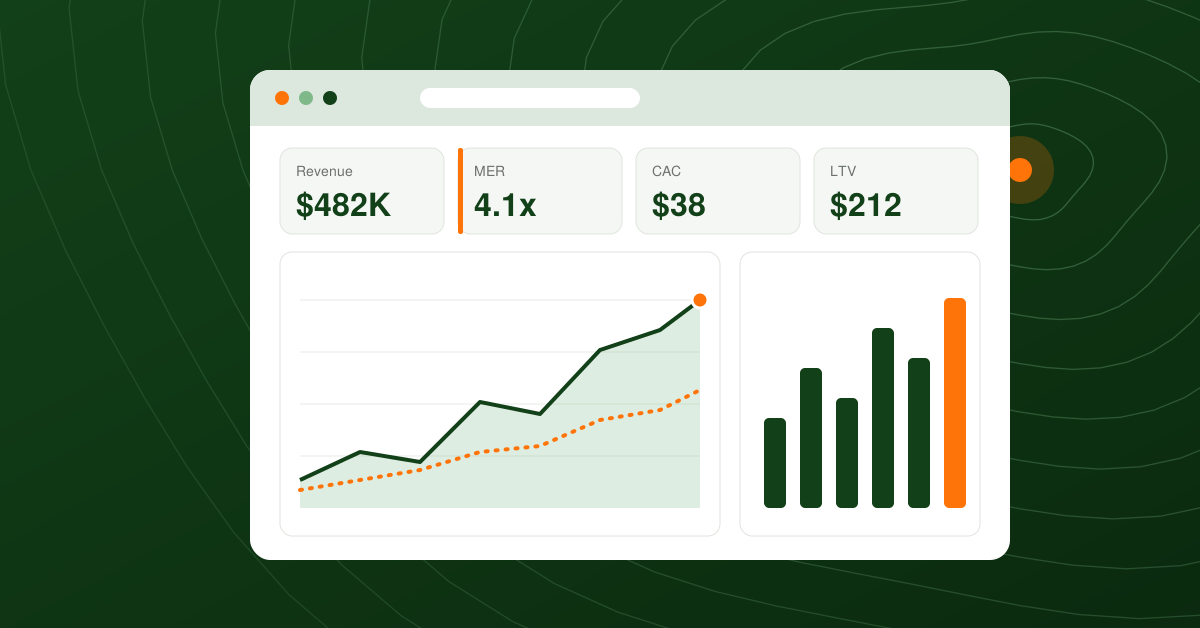
We connect all your data sources: GA4, Google Ads, Meta, Shopify, Amazon, Walmart, and your CRM into one clear view. Helping you turn insights into action faster and with greater impact.
The problem
Most growing businesses don't have a data shortage. They have a data connection problem. Every platform reports its own version of the truth, and no one has time to reconcile them.
What Changes
Every channel, sale, and lead in one place, modeled consistently so the numbers match across teams.
Dashboards that refresh as new data becomes available. No more Monday morning spreadsheet marathons.
See Customer Acquisition Cost, Return On Ad Spend, Marketing Efficiency Ratio, customer lifetime value, and margin by channel, so budget goes where it earns.
What We Do
Trace every lead from first click or call to booked job to revenue, so you know which marketing fills the calendar.
We audit GA4, tag management, and conversion tracking, then fix what's broken, so dashboards are built on data you can trust. [CONFIRM scope]
Executive, marketing, sales, and operations dashboards built in Looker Studio (formerly Google Data Studio), Power BI, or Tableau, designed around the decisions you make.
Share of search, content health, availability, pricing, and ratings and reviews across Amazon, Walmart, and other retailer sites, using platforms like Profitero and e.fundamentals, connected to your sales data.
Dashboards show what happened. Monthly analysis explains why and what to do next, in plain language.
We connect and clean your sources, blend them into a consistent data model, and structure it so reporting stays accurate as you grow. [CONFIRM warehouse tools]
Why Lakefly
Our founder, Jeffrey Pinnow built and led data teams at two companies valued at over $4 billion each, owning the dashboards, models, and reporting for executives used to make decisions at scale.
Now that same rigor is available to growing businesses, without the six-figure consulting invoice or a six-month implementation.
By the numbers
How we work
Most projects launch in 8-12 weeks.
What decisions you need to make, and whether your data can answer them.
What the work should return, and how big the plan should be.
We identify and fix areas where data collection is missing or weak
Map the data, agree on metric definitions, set the KPIs, plan the layout before building.
Connect sources, build the views, check every number at the source.
Walk your team through it, document it, refine as questions change.
Review
What decisions you need to make, and whether your data can answer them.
Forecast
What the work should return, and how big the plan should be.
Tracking
We identify and fix areas where data collection is missing or weak
Model
Map the data, agree on metric definitions, set the KPIs, plan the layout before building.
Build
Connect sources, build the views, check every number at the source.
Launch & Train
Walk your team through it, document it, refine as questions change.
Plain and simple language
Every dashboard we build is anchored to a handful of numbers. These are the ones that tend to decide what a business should do next, and what each one really means.
Total revenue divided by total marketing spend across every channel. Unlike channel-level ROAS, MER can't be inflated by platforms claiming credit for the same sale, which is why it's usually the first number we put on an executive dashboard.
Total sales and marketing spend divided by every new customer acquired, regardless of channel. Platform-reported CAC almost always looks better than blended CAC, and the gap between the two is one of the fastest ways to spot where a reporting problem is hiding.
Revenue left after the variable costs of delivering a sale: product cost, shipping, payment fees, and returns. Reporting on revenue alone can make a product look like a winner when it loses money on every order, so we model margin by SKU wherever the data allows.
The total margin a customer generates across their whole relationship with you, not just their first order. It's what determines how much you can afford to pay to acquire someone, and it's the number most small businesses have never actually calculated.
Your share of total search volume or search result visibility in a category, on Google or on a retailer like Amazon. It moves before revenue does, which makes it one of the few genuinely useful leading indicators.
A dashboard is live and always on, so anyone can check where things stand right now. A report is a point-in-time analysis that explains why something happened and what to do about it. Dashboards without analysis tend to get ignored by month three.
Still have questions? Ask them directly and you'll get a straight answer.
Google Data Studio (formerly Looker Studio) is free and connects natively to Google products, making it a strong fit for marketing reporting.
Power BI and Tableau are licensed platforms with more powerful data modeling for complex or high-volume data.
We'll recommend the right fit for your data, team, and budget.
Dashboard projects start at $3,500, but price depends on the number of data sources, how much cleanup and modeling your data needs, and how many viewers you require.
You'll get a fixed quote after a free data review.
Most projects launch in 8-12 weeks. Timelines depend mostly on data access and how clean your tracking is.
Yes. Google platforms connect natively to Looker Studio.
Non-Google sources like Meta and Shopify typically require a third-party connector or a data warehouse.
We'll recommend the most cost-effective option and list any tool costs in your proposal.
Yes, and it's very common. We start with a tracking audit and fix conversion and event setup first, so your dashboards are built on data you can trust.
Digital shelf analytics tracks how your products appear and perform on retailer and marketplace sites, including search rank, content quality, pricing, availability, and reviews. Connecting it to sales data shows which fixes, such as better content or fewer stockouts, actually move revenue.
Yes. Everything is built in accounts you own and control. [CONFIRM]
Where we work
Based in Fort Wayne, we help businesses across the region make better decisions with their data, on-site when it helps and remotely when it doesn't.
Discovery sessions and dashboard training can happen in person or remotely, with build work done remotely.
Our home market is Fort Wayne and Northeast Indiana, including New Haven, Huntington, Auburn, Angola, Kendallville, Warsaw, Columbia City, Decatur, and Bluffton. We also serve businesses in Northwest Ohio, and Southern Michigan.
We'll look at your current reporting, spot the gaps and show you what a connected view could look like. You'll hear back within one business day.
Your Cart
Your cart is empty
Access this document
Pre-Order
Get in touch